By linking Analytics and Google Ads, you can view your Google Analytics statistics in Google Ads and analyze Google Ads performance in Google Analytics.
Linking Google Ads with Google Analytics is about much more than just collecting and displaying data. The key point is that you gain insights that can give you a competitive advantage.
Essentially, it is about analyzing users regardless of whether they generate conversions or not. This is where the strength of Google Analytics lies. You get an overview of the extent to which you are reaching relevant users with Google Ads. Based on this data, you can change bids and ad texts and redefine the time and place of the ads in order to reach the users, who then generate conversions.
Even simple evaluations can lead to a noticeable improvement in your Google Ads account performance. For example, by finding keywords without conversions that nevertheless generate traffic of above-average quality (low bounce rate, long time spent on the website, etc.).
Analyze Google Ads in GA4
Unlike GA3 (also known as Universal Analytics), GA4 does not provide a pre-built report to measure Google Ads performance. However, you can create this report from scratch using the exploration report templates.
Follow the steps below to create a Google Ads report in GA4 using the Exploration report template:
Step 1
Make sure your Google Ads account is linked to your GA4 property. This step is required to get the Google Ads data in your GA4 property.

step 2
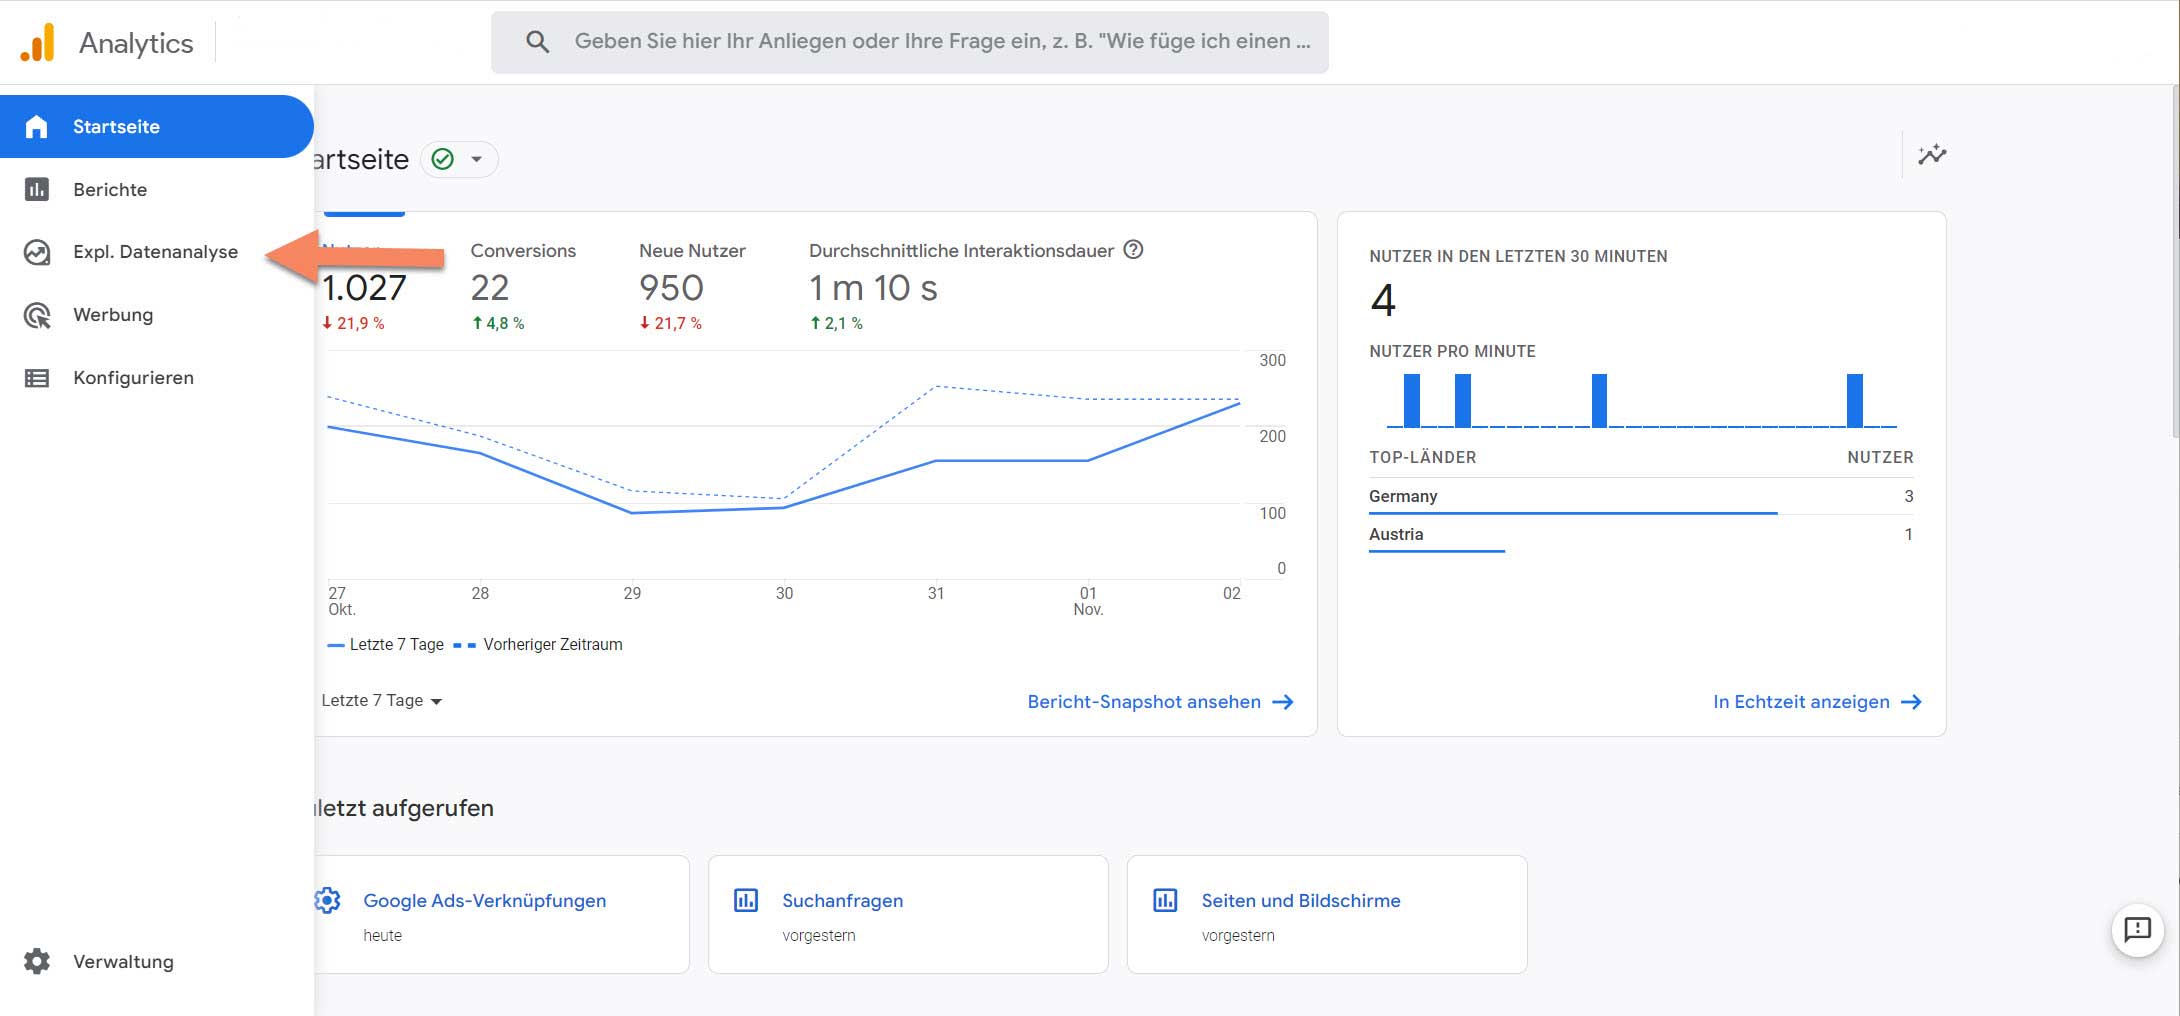
Click on the “Exploratory Data Analysis” link in your GA4 instance

Step 3
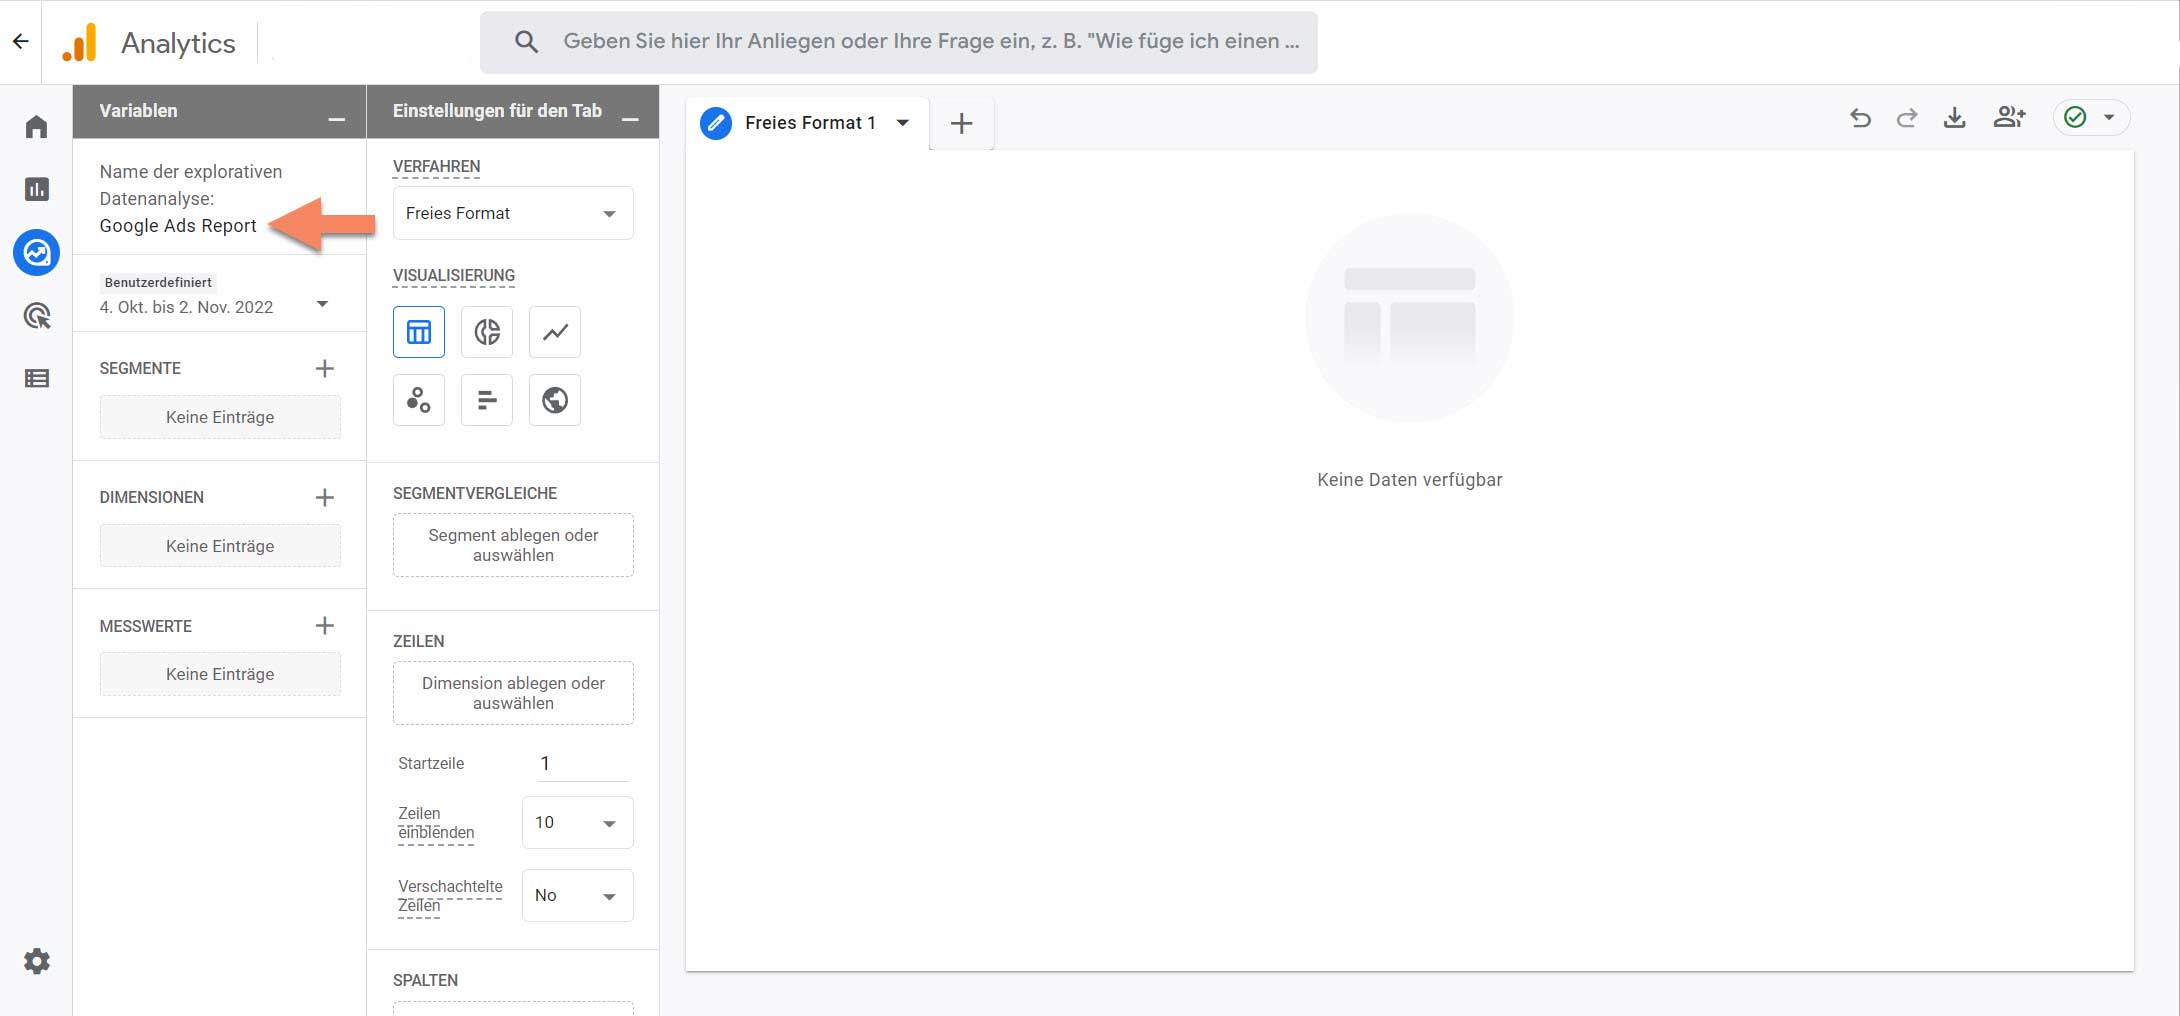
Click“+” on the exploration template to create a new exploration report from scratch.

Step 4
Name your report ‘Google Ads Report

Step 5
Click the “+” button next to “DIMENSIONS” to add new dimensions to the report

Step 6
Enter ‘google ads’ in the search box to find all dimensions related to ‘Google Ads

Step 7
Select the Google Ads dimensions you want to see in your report, and then click the “Import” button.

Step 8
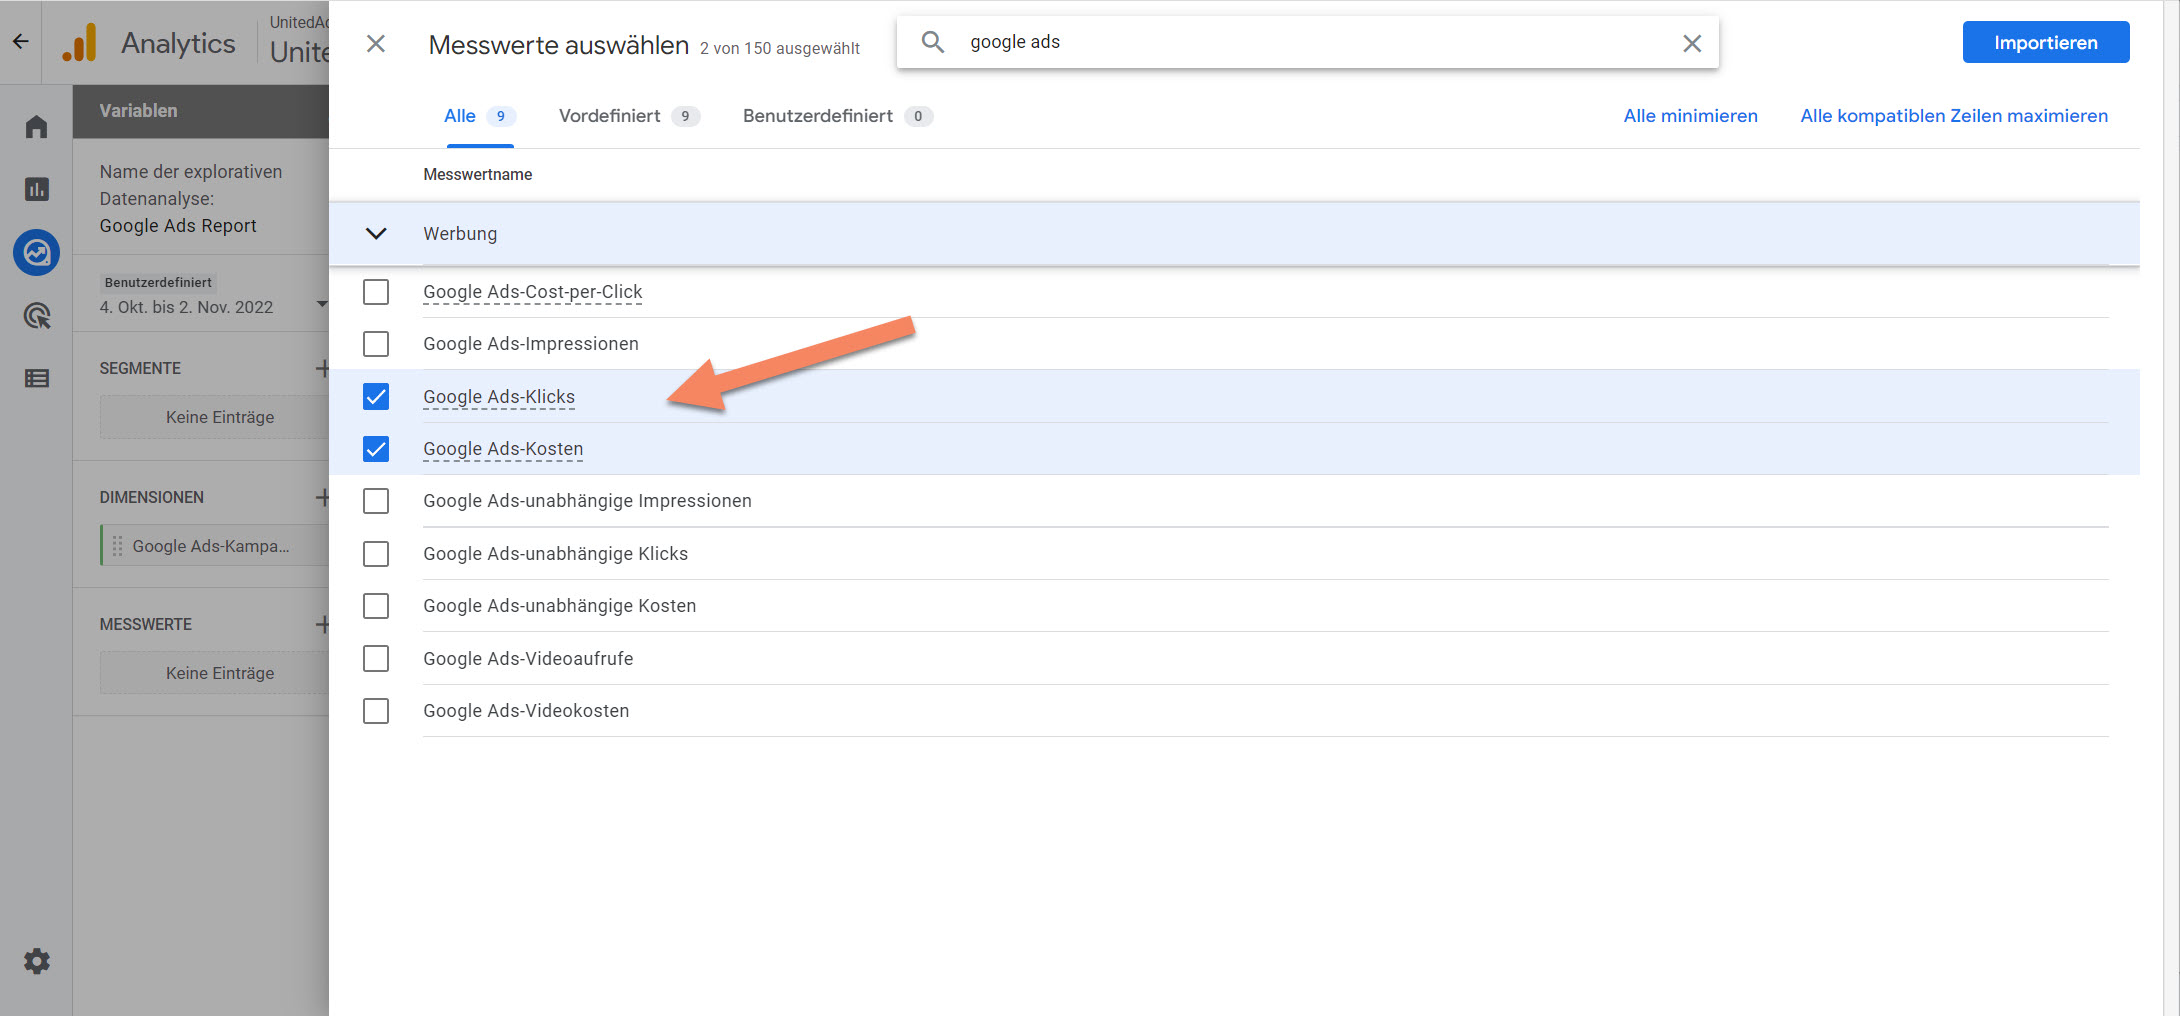
Click the “+” button next to “MEASUREMENTS” to add new metrics to the report.

Step 9
Type “google ads” in the search box to find all metrics related to “Google Ads”.
Step 10
Select the Google Ads metrics you want to see in your report, and then click the “Import” button.
Note: Hover the mouse cursor over a metric name to learn more about the metric.

Step 11

Double-click the dimensions one by one to add them to the report on the right.
Congratulations!
You have successfully created a Google Ads report in GA4.
Question: Do users behave differently on my website if they arrived via a top-position ad?
Here’s how to get the answer: Add the Ad Space dimension to your campaign/ad group reports.

Question: Should I add more exact match keywords to my campaigns?
Here’s how to get the answer: Use the Match type of search query option in your campaign reports.

Question: Are there certain keywords that will perform better on mobile?
Here’s how to get the answer: Use the Device Category option in your keyword reports.
Will my keywords still generate high quality traffic without conversions?
Here’s how to get the answer: Analyze usage behavior for keywords with a “goal conversion rate” of 0%.
Should I add more specific keywords to my campaigns to better manage those traffic?
Here’s how to get the answer: Analyze your campaigns with the secondary dimension “Search query match type”.
Are there any behaviors that go beyond website conversions that I should consider when setting my Google Ads bid adjustments?
Here’s how to get the answer: Analyze usage behavior by device, location, and ad schedule
How do Google Ads users react to my website?
How to get the answer: Analyze user behavior and conversion rate for different Google Ads landing pages.
How to use the structure maps in Google Ads for a quick and intuitive analysis
Use the Structure Maps report to visually review trends in your Google Ads data, making it quick and easy to hypothesize your advertising campaigns. Like all Google Ads reports in Google Analytics, this report includes both Google Ads metrics (such as clicks and CPC) and Analytics metrics (such as bounce rate and revenue).
In the “Structure Maps” report, the data is presented in the form of rectangles. The size and color of each rectangle represent different metrics, so you can combine different aspects of your data into a single visual representation. Structure maps are a good hypothesis tool because they can help you determine the relative importance of, and the relationship between, different elements.

Analyze the performance of your Google Ads keywords
First of all, it makes sense to use this report to compare the actual performance of your keywords. However, most Google Ads managers are more likely to do this work directly in the Google Ads account. This has the advantage that you can edit the keywords there too.
This report contains little additional information compared to the Google Ads account. However, the more flexible presentation of the data can be quite helpful here. For example, by using the secondary dimension “keyword option”. For example, if the use of “Exactly Fit” is only moderately successful, you should try the “Largely Fit” option.
Which search queries generate conversions?
The Search Queries report shows you the actual searches that led to your Google Ads ads. You can use this information about how people are searching to refine your keyword list in Google Ads.
Here, too, the secondary dimension plays an important role. Add keyword as a secondary dimension to determine which keywords triggered in your account for which searches. Here, too, the display is more flexible than in Google Ads. For example, you can create a segment for particularly valuable search queries and analyze them in isolation.
What time of the day does my offer sell best?
If you sell a service or product within a specific region or country, it may be beneficial to target your ads to specific times of the day or days of the week.
If you have a guess as to which times of the day and days of the week are best for your purposes, you can use the information in this report to check. Then you would adjust the ad scheduling in Google Ads accordingly.
Of course, you can again add a keyword as a secondary dimension, for example, and sort the data according to sales to see whether certain keywords are more effective at different times of the day.
Which Google Ads landing pages are performing the best?
This report includes the URLs your users have been redirected to with your Google Ads ads and the tagging of campaigns in those URLs, if they have been set up.
So this report serves as a landing page report for Google Ads traffic only. So with this report you can analyze which pages are most effective in terms of engaging your users and generating the conversions you want.
The Advertising Network report data view helps you determine which distribution methods (such as Google’s search network or Google’s display network) are most effective. If you are showing the same ads everywhere, but one network is performing significantly less, you may want to try showing other ads on that network.


