One of the most important sub-items in the “Behavior” area is the “Website Content” menu item. This will probably be one of the reports that you view most often. Below are the reports that give you a quick overview of the content of your website. There you will find the item “All Pages”, where you can see an overview of all the pages on your website and the associated most important metrics. You can also see the “breakdown by content” as well as the target and exit pages.
With the content reports from Google Analytics you can see the top content of your website. Analyze how often visitors visit the individual pages of the website, how long they stay there and how often conversions or transactions take place.
Possible questions for the area of website content
- How often are individual pages accessed?
- How long do visitors stay on certain pages?
- On which pages do users start visiting the website?
- Which pages lead to an exit from the website particularly often?
- How often do visitors leave the website immediately, and on which pages do they do this most often?
- What is the bounce rate of your campaign landing pages?
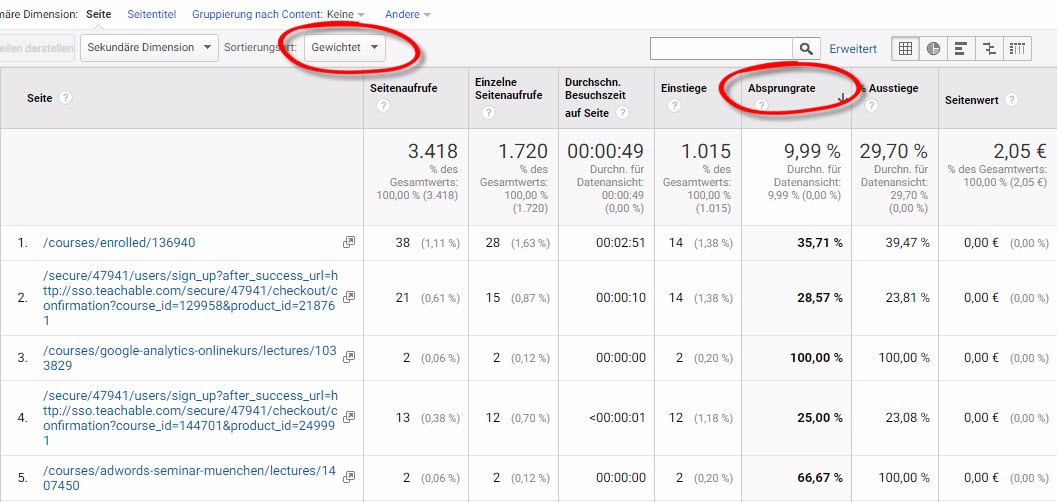
In all reports you have the option of clicking on the individual entries in order to be able to analyze this page only. Next to the pages you will see small arrows that you can use to open the respective website directly in a new browser window. To do this, the correct standard URL must be stored in the setting for the data view. Of course, you can filter and sort the reports as usual, sort them by bounce rate and use the various table views
All pages – overview of your top pages
Under the navigation point “All Pages” you get an overview of all the pages on your website. There you can see how many page views, unique page views and accesses to certain pages have occurred. You can also see the average visit time on the pages, the bounce rate, the percentage of exits and the monetary page value, provided you have set up e-commerce tracking or assigned monetary values to your goals.
All Pages – The Dimension »Page Title«
In the “All Pages” report, you have the option in the navigation above to switch to the other primary dimension “Page title”. The titles of the pages called up are shown here. This is an advantage if you use less meaningful URLs. In this view you can see the titles of the pages and thus receive a more informative report.
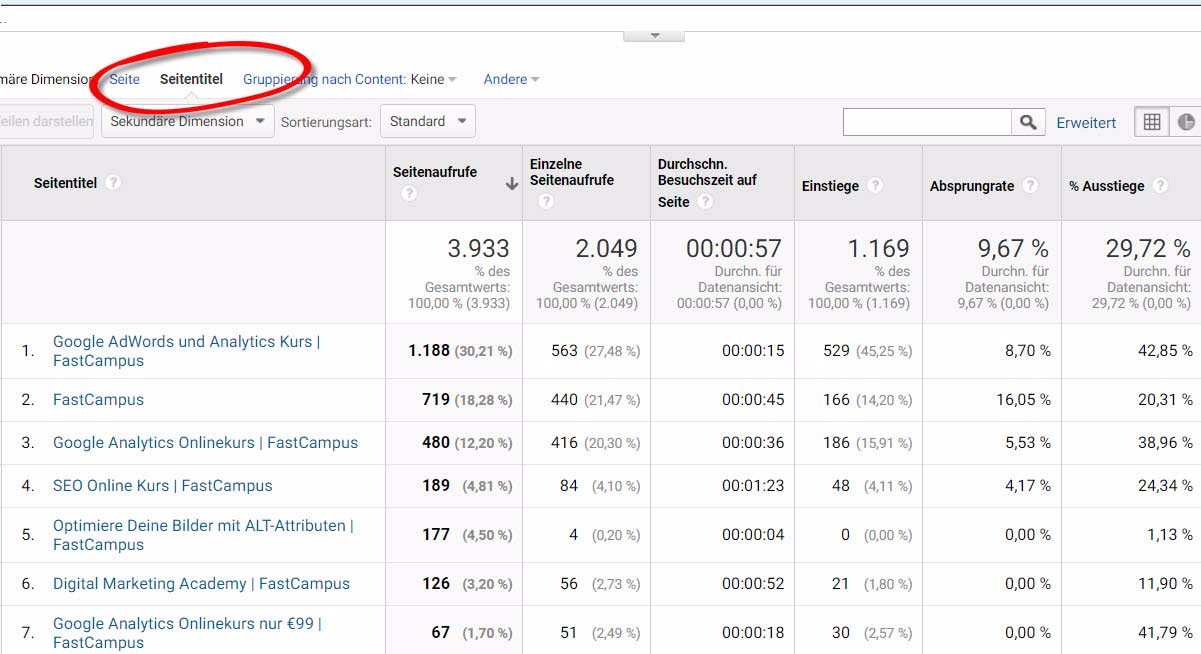
If you use the same title several times (which you should generally avoid), several pages will be summarized here and can no longer be evaluated individually.
However, this can be helpful when using parameter URLs, as this allows you to merge different page entries using the same title.
In general, it is recommended – especially for reasons of search engine optimization – to create unique titles for each page of a website. The title of a page is what is shown on Google as the “heading” of the search hit. It thus attracts the user’s gaze and should prompt him to click on the search result.
You can also select a page title and add the secondary dimension “Page” to find out whether the same page title is also the same URL or not.
Navigation overview – from where to where do users navigate?
The navigation overview offers you a quick and uncomplicated insight into the navigation processes of your users. If the navigation and visitor flows are too confusing for you, you should try this report. Here you can see which pages your users viewed before visiting a particular page and what they viewed afterwards.
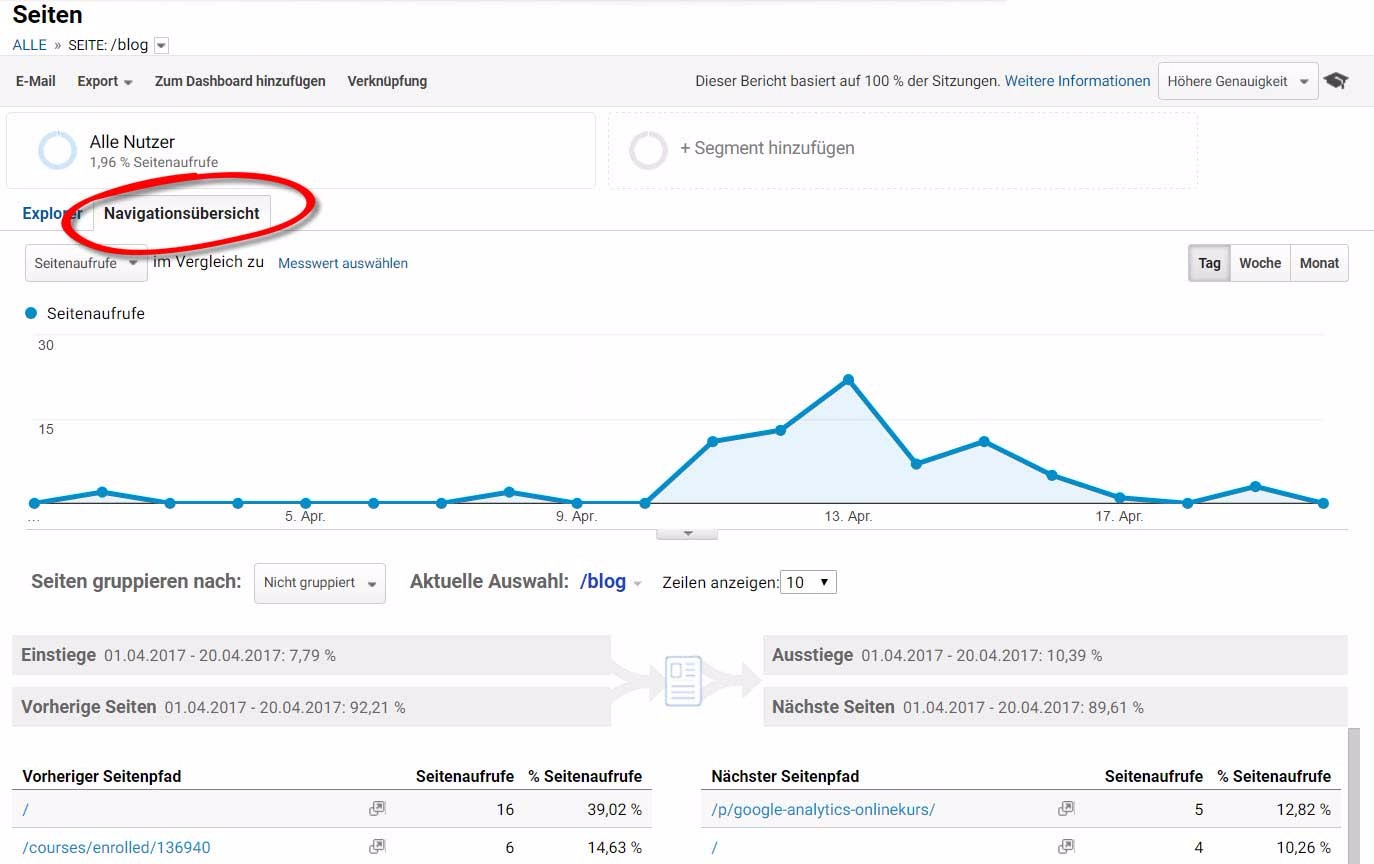
The reports are always structured in the same way. At the top next to the term “Current Selection” you can select the page that you want to analyze using the drop-down menu. At this point you can also use the search function, for example to get to pages that are clicked on less frequently.
Landing Pages and Entry Paths – Which Pages Do Visits Start From?
The report on the exit pages shows you the pages on which visitors leave the website most frequently. You must not confuse exits with jumps. Regardless of how many pages the visitors visited before, the report shows the pages on which users end their visit
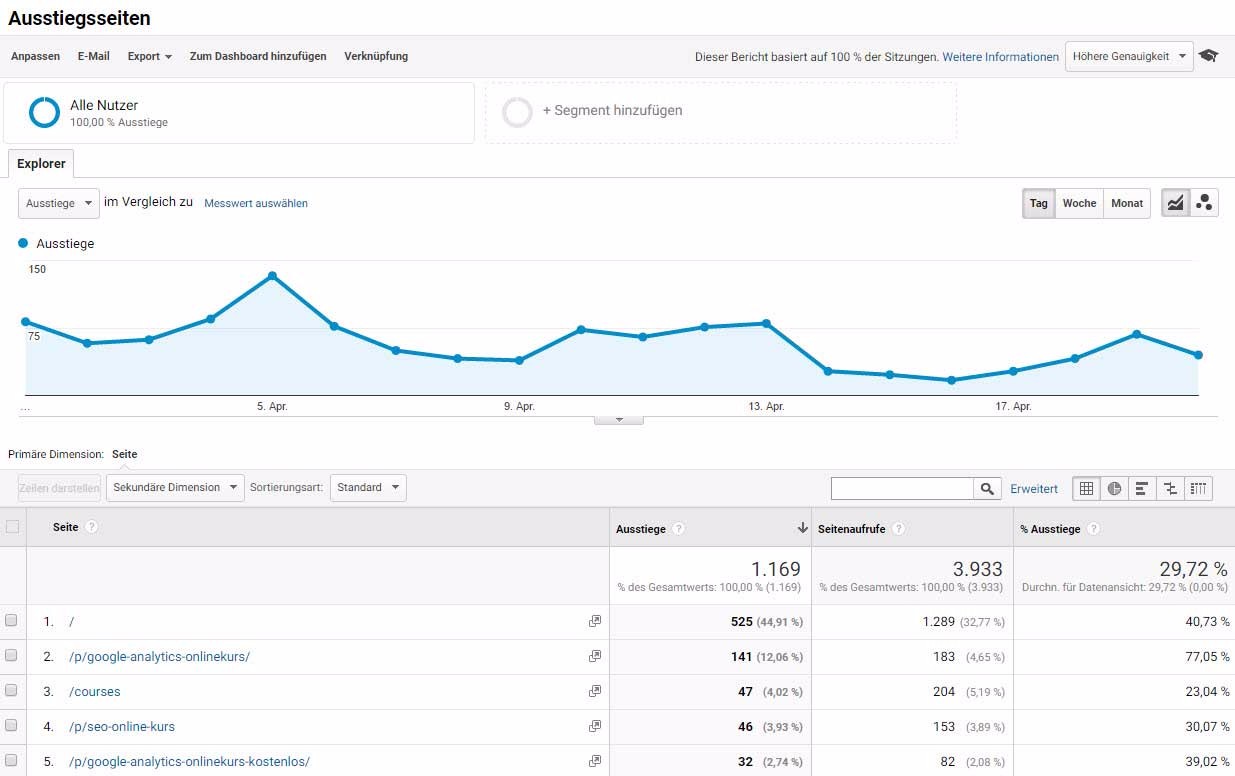
Often you will also find pages in this evaluation that have a high bounce rate. For example, the homepage is on this list for most websites because users often cancel their visit to the website here. However, pages on which visitors frequently complete a visit are also typical at this point, for example an order confirmation page, a contact form or directions. If necessary, you should filter out such pages from the report so that it is really meaningful. Of course, high exit rates are unpleasant for pages that are in the ordering process.
However, it is always worthwhile to analyze the pages that have a particularly high exit rate. It is possible that a further link no longer works, an important element is no longer displayed, or other technical problems arise, in which the users drop out. It can be helpful if you use “browser” or “operating system” as a secondary dimension to analyze whether the problems occur specifically with certain browsers or operating systems. This allows you to identify and correct problems more quickly.
This report is not very extensive either, since you only see the exit pages, exits, page views and the proportion of exits.
Page reports for the analysis of search engine optimization
You probably also want to use Google Analytics to check the effects of your search engine optimizations. After all, analytics is moving more and more towards a general purpose tool for webmasters.
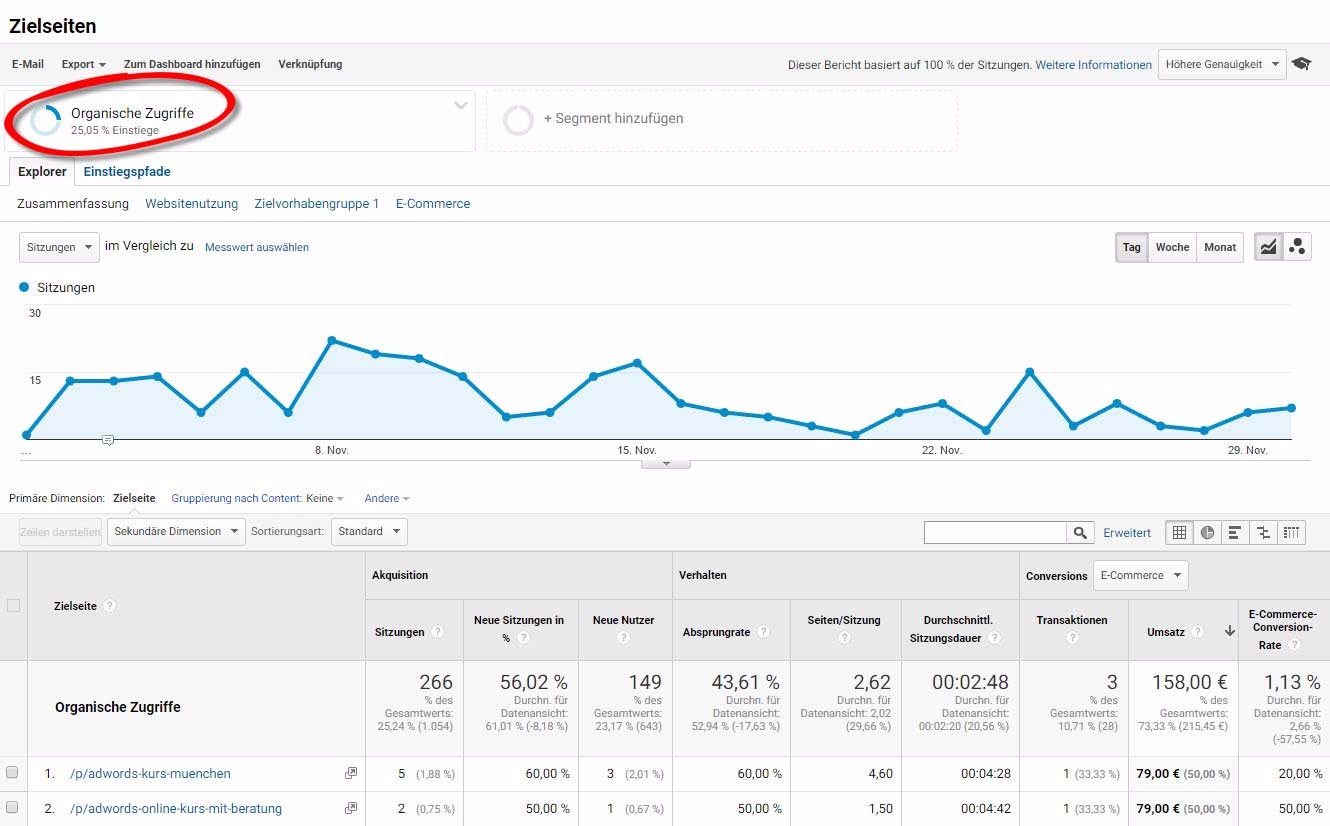
The landing page report is particularly interesting for these purposes, as it allows you to see which pages have most frequently led to your website being launched. If you use the “Unpaid search traffic” segment on this report, you can see which pages have been accessed particularly frequently by search engines. You can evaluate the data even more precisely if you create your own segment, which only evaluates the visitors via organic Google search queries.
In times of almost 100% (not provided) information, these reports are becoming more and more important. If you have optimized a certain website area in the last few weeks, you could now filter by the URLs and use a time period comparison to see whether the organic traffic to these pages has increased.
The term “not provided” has appeared on Google Analytics since Google introduced Secure Search in October 2011. The term summarizes all page views whose search query is no longer made available by Google. With the Secure Search, an entered term is encrypted with the help of SSL and thus sent over a secure connection. Google sees the request as personal information and therefore does not pass it on. The website operator only receives “not provided”.
Landing page reports for analyzing campaign landing pages
Landing page reports are not only suitable for analyzing search engine optimization measures, but also for analyzing your marketing campaigns. Google Analytics helps you with the analysis to find out which campaigns and landing pages convert particularly well. The landing page report gives you information about how well your landing pages are working.
In different ways you can evaluate how high the bounce rates are, how many conversions or transactions were carried out and much more.
Grouping by content – evaluate your content according to individual content groups
Google Analytics gives you the option to group your content. This is done using one of these three possible methods:
- Change the tracking code on each page to be grouped
- Extract pages using regex capture groups
- Create rules for assigning pages to a group
Typical questions you can answer with the help of content groupings
- Do individual visitor groups exhibit different behavior than the website average ?
- Which product groups are viewed most often?
- What topics are your visitors particularly interested in?
Depending on the website type, you can group content into meaningful content groups that allow you to analyze the visitor flows in a more structured manner. How you ultimately group your content is entirely up to you.
You will not find the data on content groupings in a separate report, as you are used to from the other dimensions and metrics. Instead, you can control the content groupings via the content reports.
You can find a basic analysis of the content groupings, for example, in the report “All Pages”. Change the primary dimension from “Page” to “Grouping by Content” and select the desired content grouping.
Overview of the content grouping “visitor groups”
In this overview you can already see how many page views are attributable to the individual groups and what the average length of stay on the pages is. The metric UNIQUE CALLS is new in this report. This value indicates the number of sessions in which a page of the content group was accessed once or several times. In the case of an entry with (Not Set), this value always remains zero, since the content groupings are calculated. If this is missing, nothing will be displayed accordingly.
The navigation overview provides you with another useful evaluation with regard to the content groups. Here, too, you can select the content grouping and thus analyze the navigation of users between certain content groups.
The data is also available to you in the reports on the target pages or the website speed. Content groups can be used particularly well within user-defined reports or in dashboards. In this way, merge the data in such a way that it facilitates your work.
With which metrics can the content groupings be evaluated?
Since the content groupings are dimensions that are based on a page view, you can only evaluate metrics in this context that are also based on a page view.
These are, for example, page views, unique page views, length of stay on the page or the like. Unfortunately, you can’t relate session-based metrics like conversion rate or revenue to content groupings.
Exits and exit rate compared to jumps and bounce rate
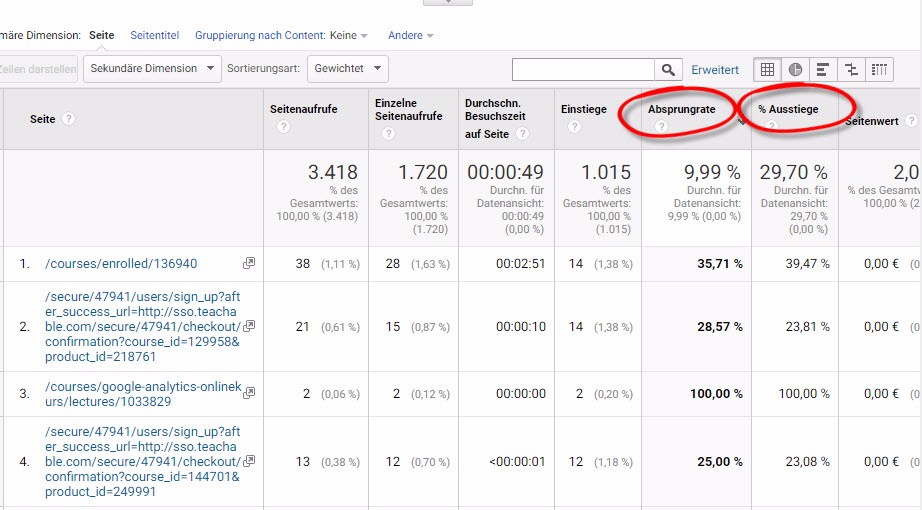
In many reports, exits and exits as well as exit and exit rates are displayed as metrics. But where is the difference?
The difference between exit rate and bounce rate for a given page can be described as follows:
- For all views, the exit rate indicates what percentage of the page views were the last in the session.
- For all sessions that begin with the page, the bounce rate is the percentage of hits that were the only pageview for the session.
- A page’s bounce rate is only based on sessions starting on that page.
- The most important difference between exiting and jumping off is that an exit must have generated other pages beforehand. A jump always includes only one page view, whereas an exit can contain several page views in one visit.
With Google Analytics, a jump is counted if a session is only triggered by a single request to the Analytics server, for example if a user only visits one page of your website and then leaves the page without further requests to the Analytics server for this session. Servers are triggered.
The bounce rate is the result of visits to a single page divided by all sessions. It is the percentage of all sessions on your website in which users only visited one page and only triggered one request to the Analytics server.
These visits to a single page have a session duration of 0 seconds, since no more hits are obtained after the first that can be used to calculate the session duration in Analytics.
Interpretation of the bounce rate
But remember that a jump is also counted if someone stays on the page for a long time, e.g. to read through a text and then leave the website. Analytics would also rate this as a jump, although from a factual point of view this is not the case. In this case, the second action that would end the exit is missing. This is a problem, for example, with blogs whose content can only be found on one page or blogs that have very long texts. If no further adjustments are made here, the bounce rate is very high. For example, you could automatically trigger an event after 3 minutes in order to achieve a more realistic bounce rate.
In addition, the bounce rate may be incorrectly calculated if automatic events are triggered, for example the loading of a chat window. Here it is important that you make sure when integrating the events that they are either triggered by the user or – if they are triggered automatically – do not affect the bounce rate.
Is a high bounce rate generally a bad sign?
If the success of your website relies on people visiting multiple pages, then a high bounce rate is problematic. If the start page is the starting point for the rest of your website (e.g. news articles, product pages, booking pages) and the majority of users only look at the start page, a high bounce rate is actually unfavorable.
However, if your website contains only one page (e.g. a blog) or you provide content for which visits are primarily expected from only one page anyway, a high bounce rate is normal and of course not a problem.
Look at the bounce rate from different angles.
- You can find the overall bounce rate for your website in the “Target group overview” report.
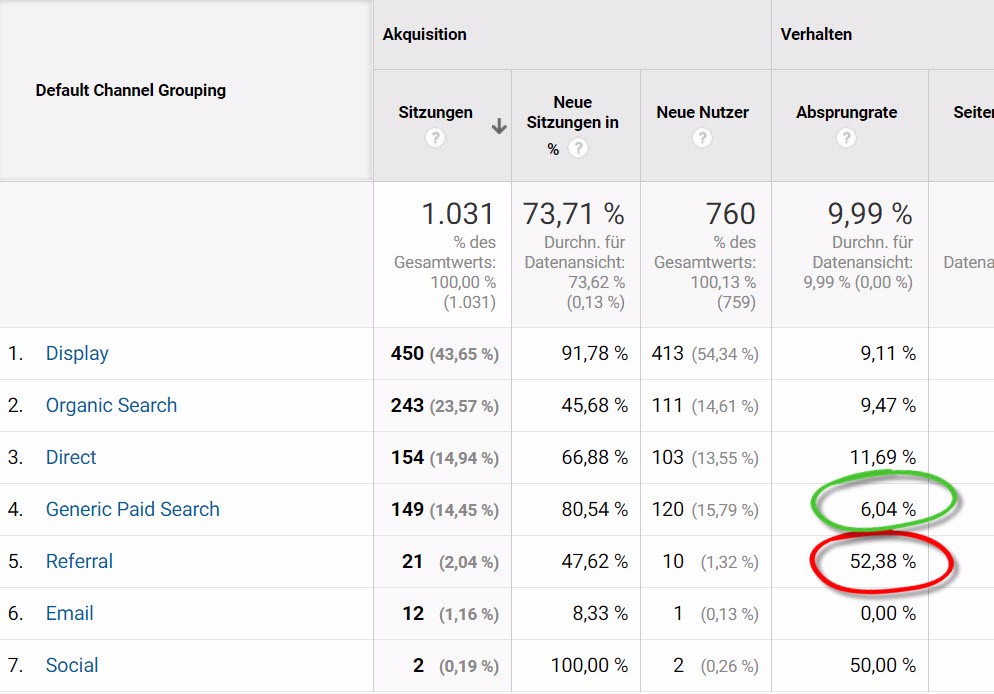
- The Channels report shows the bounce rates for each channel grouping.
- You can see the bounce rates for every combination of source and medium in the report “All hits”.
- You can find the bounce rates for individual pages in the “All Pages” report.
If the overall bounce rate is high, you can break down the data further to find out whether it is generally high or whether it affects a certain marketing channel, certain combinations of source and medium or only certain subpages.
For example, let’s say the high bounce rate is based on certain pages. In this case, you should investigate whether your content fits the campaigns with which you are driving users to the pages. Also, check if users can easily perform the further steps on these pages.
If a certain marketing channel has a high bounce rate, analyze your marketing for this channel. In the event that visitors bounced off the Display Network, you should check that your ads are relevant to the content of your website.
If the problem is more far-reaching, you should take a look at the implementation of your tracking code and make sure that all required websites are tagged. You could also review the overall design and layout of the website and control the content, language, graphics, color, calls-to-action, and visibility of important page elements.


